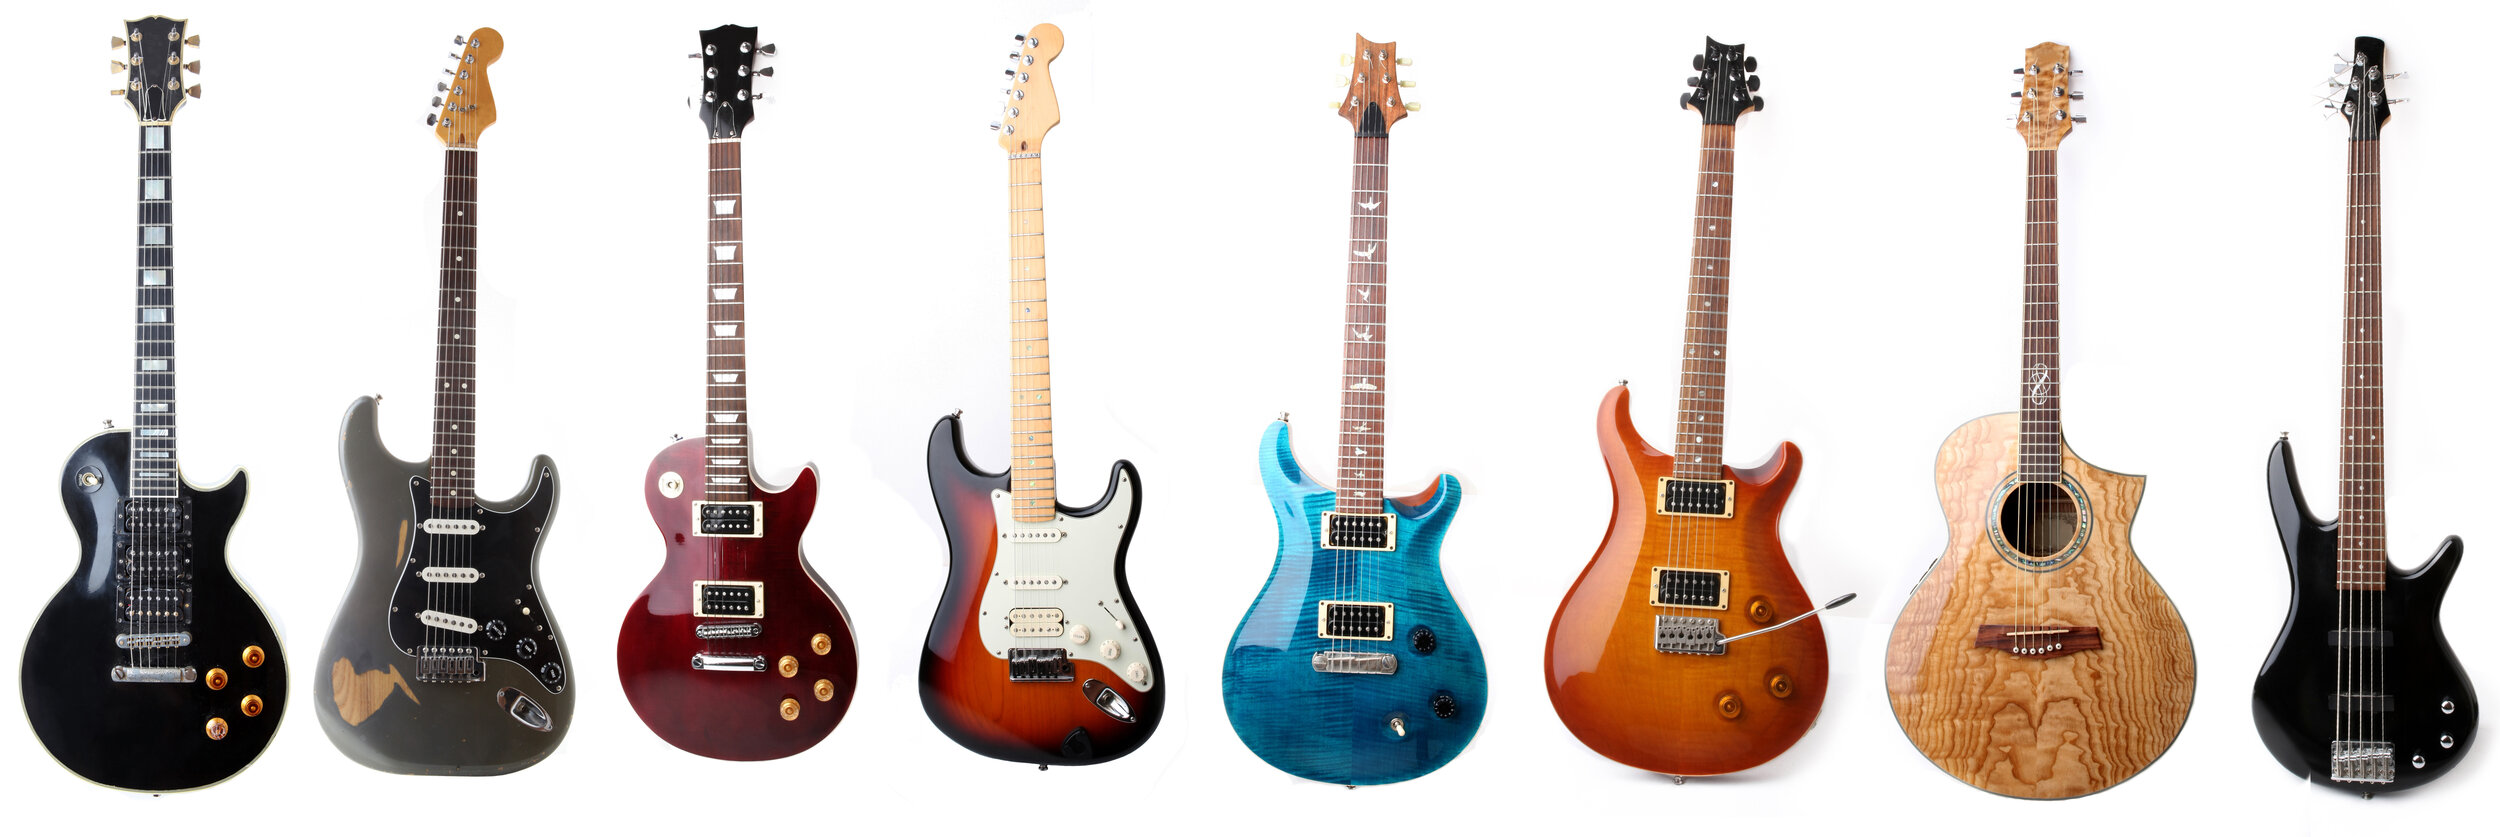
The greatest guitar of them all
Dan
19 Aug 2024
What's inside the head of 1600+ guitarists?
If you ever had the misfortune of visiting guitarist forums, you know that these are weird corners of the internet where you'll meet enthusiasm (of the purest form) and insufferable geek talk in equal measures. Guitarists, for some reason, have an obsession with their gear and the ways they can improve it. Of course this isn't unique among musicians, but I'd boldly claim that guitarists' never ending quest for the "perfect tone" is simply unmatched by other musicians (ok, maybe we can count drummers as a close second).
We wanted to know what are the key factors driving guitarists to buy an instrument and understand what determines their satisfaction with it. To start with a punchline, (that is closely mirroring the famous Anna Karenina principle), we can state that: all happy guitar buyers are alike, each unhappy guitar buyer is unhappy in its own way.
What am I looking at?
We extracted a unique dataset from the much loved Amazon Review Data Collection. It contains the reviews and details of more than 1600 electric guitar purchases from Amazon, spanning 15 years. The reviews alone would fill more than 500 pages. Therefore analyzing this manually is out of the question. So we uploaded it to CrowdPrisma, and in 30 minutes, we were notified that our dashboard was ready.
You can have a look at it here to follow along with this blog post. Feel free to click and play around with it as much as you like. Also, feel free to share any of your insights with your friends or followers by clicking on the share button at the top right corner.
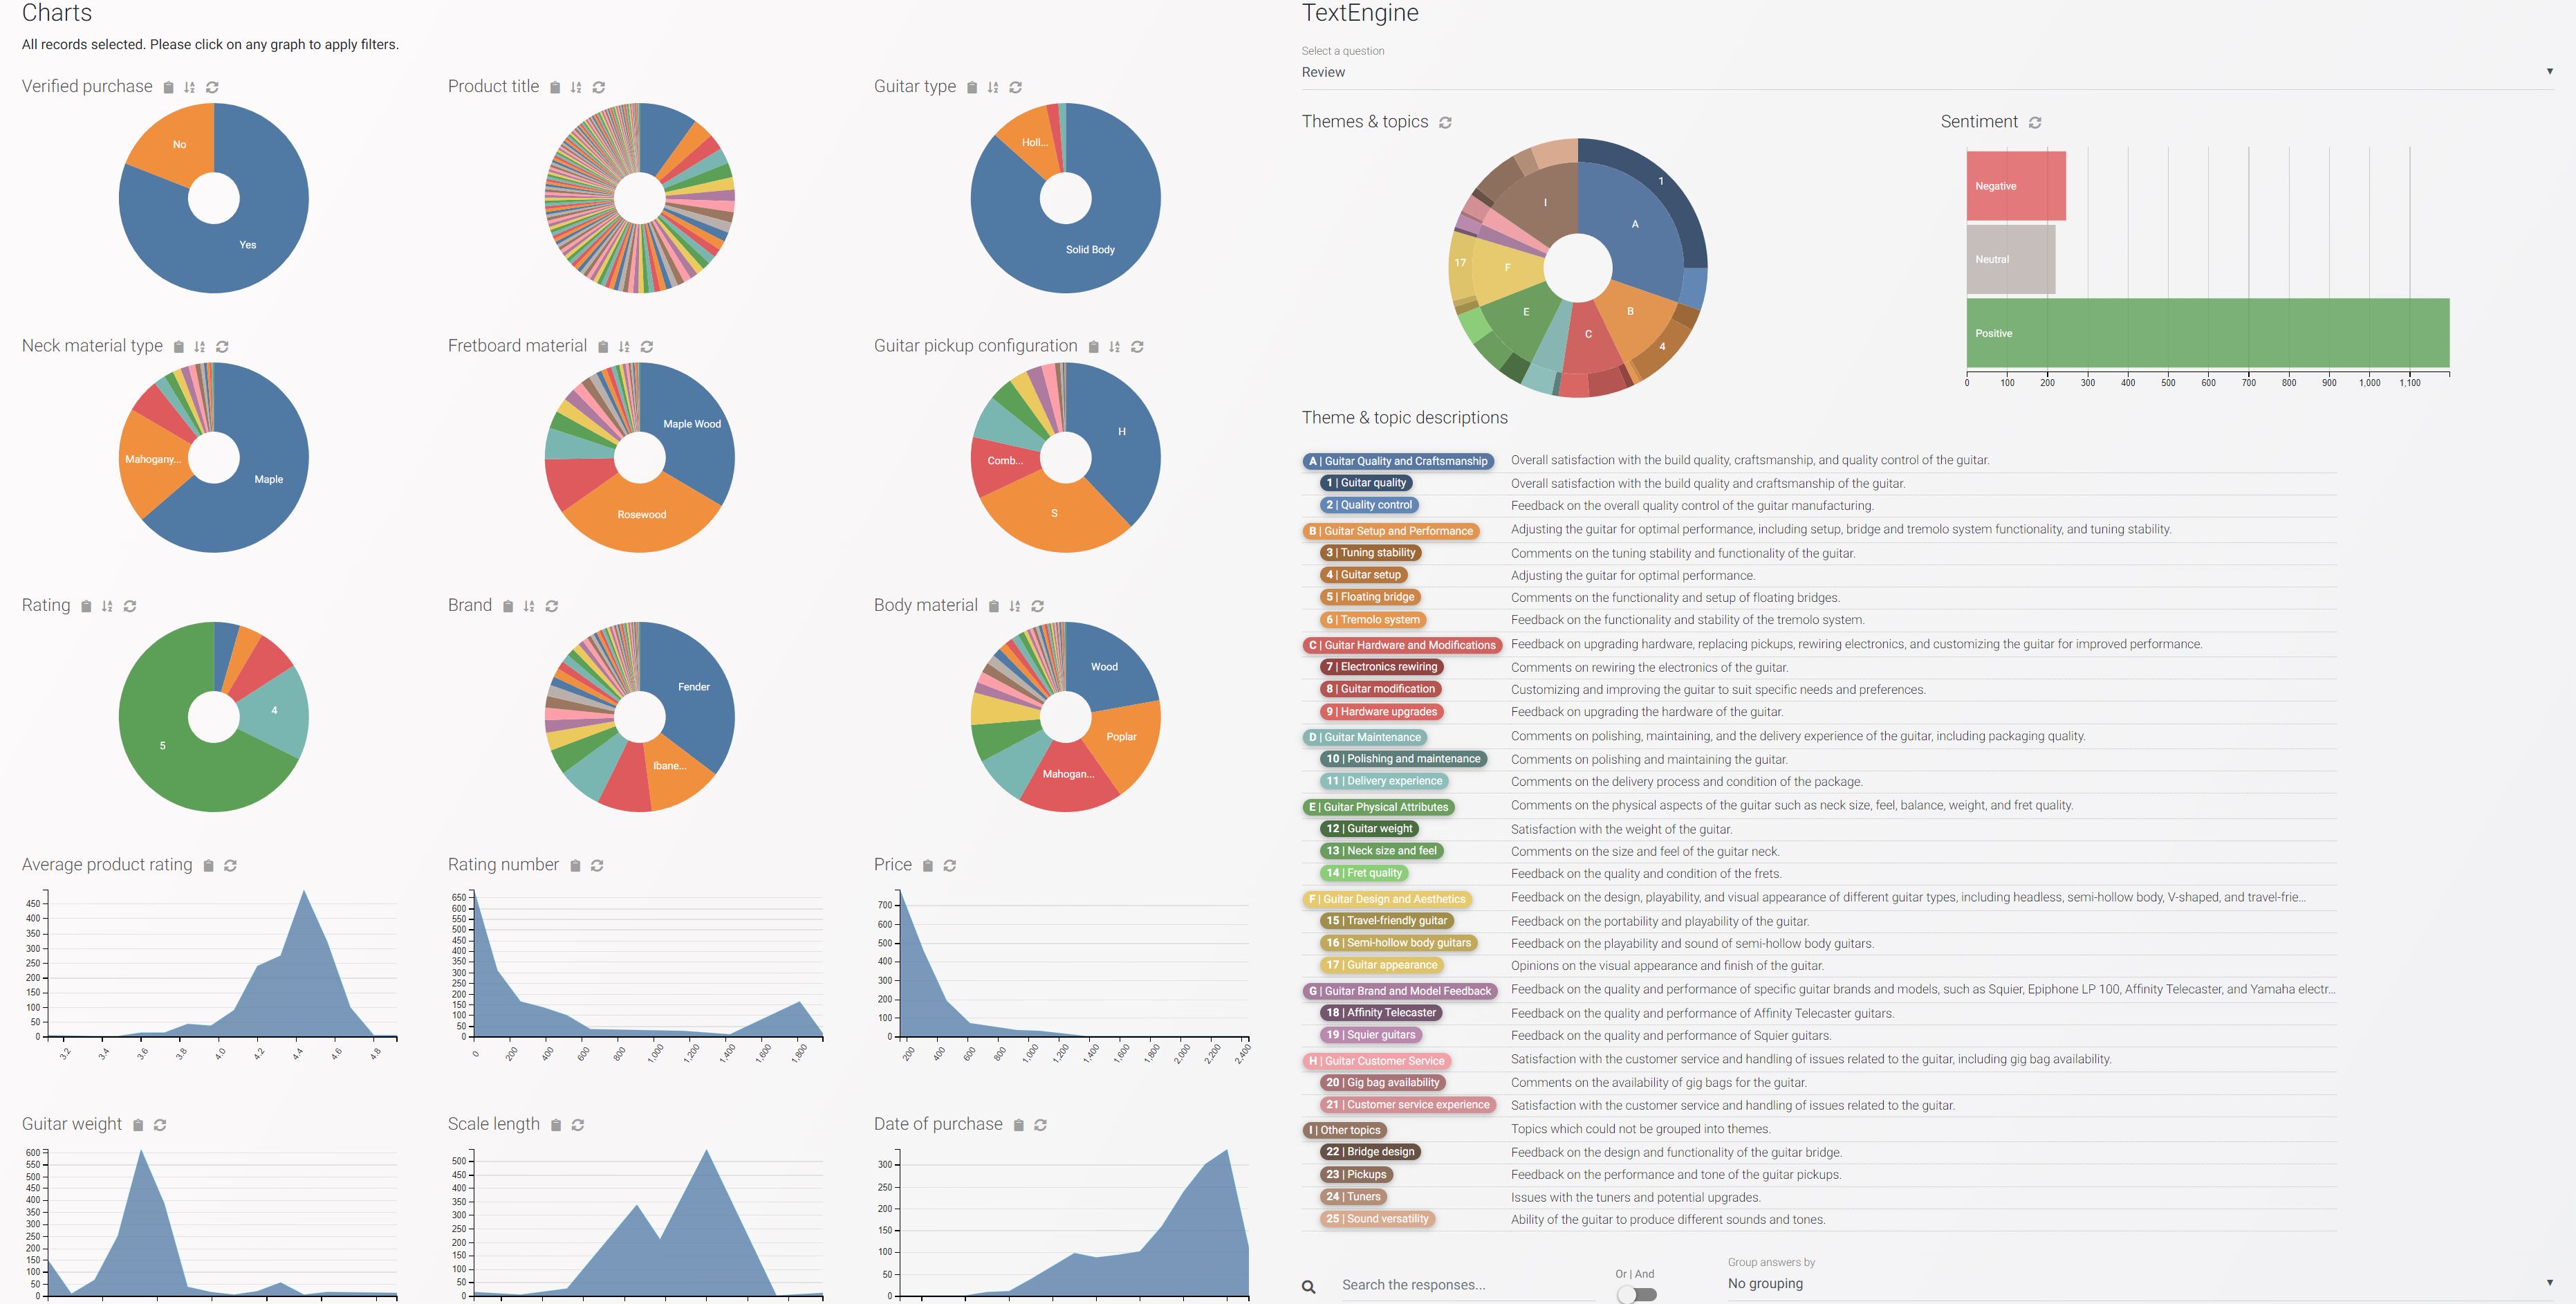
To generate this dashboard CrowdPrisma automatically detected the variable type of each question and visualized it accordingly.
- On the left you'll see
- all the non-text variables:
- 6 categorical,
- 1 ordinal (rating),
- 2 multiple-choice,
- 5 numeric and,
- 1 date.
- and the GroupFinder:
- which provides a holistic overview of the whole dataset, allowing us to spot subgroups whose responses are similar.
- all the non-text variables:
- On the right you find the Prisma TextEngine, which gives an unparalleled view into the 500 pages of free-text reviews through
- a two-level hierarchical topic wheel describing the main themes (inner circle) and topics (outer circle) that were detected by CrowdPrisma,
- a bar chart showing the sentiment of all reviews,
- a text search field allowing you to search among the reviews by (combinations of) keywords instantaneously,
- a dropdown, which allows you to group the reviews by any other non-text variable,
- the reviews themselves, finely annotated so that each sentence (or part of it) is assigned to one or several of the aforementioned topics.
Since all of the components are interlinked and infinitely filterable, this dashboard provides a one-stop-shop for answering any questions you might have about this dataset with a few simple clicks.
How to use the dashboard?
Put it simply, you come up with a question and you point and click until you have got your answer. Simple as that. Let's see a few examples:
What do guitar buyers care about the most?
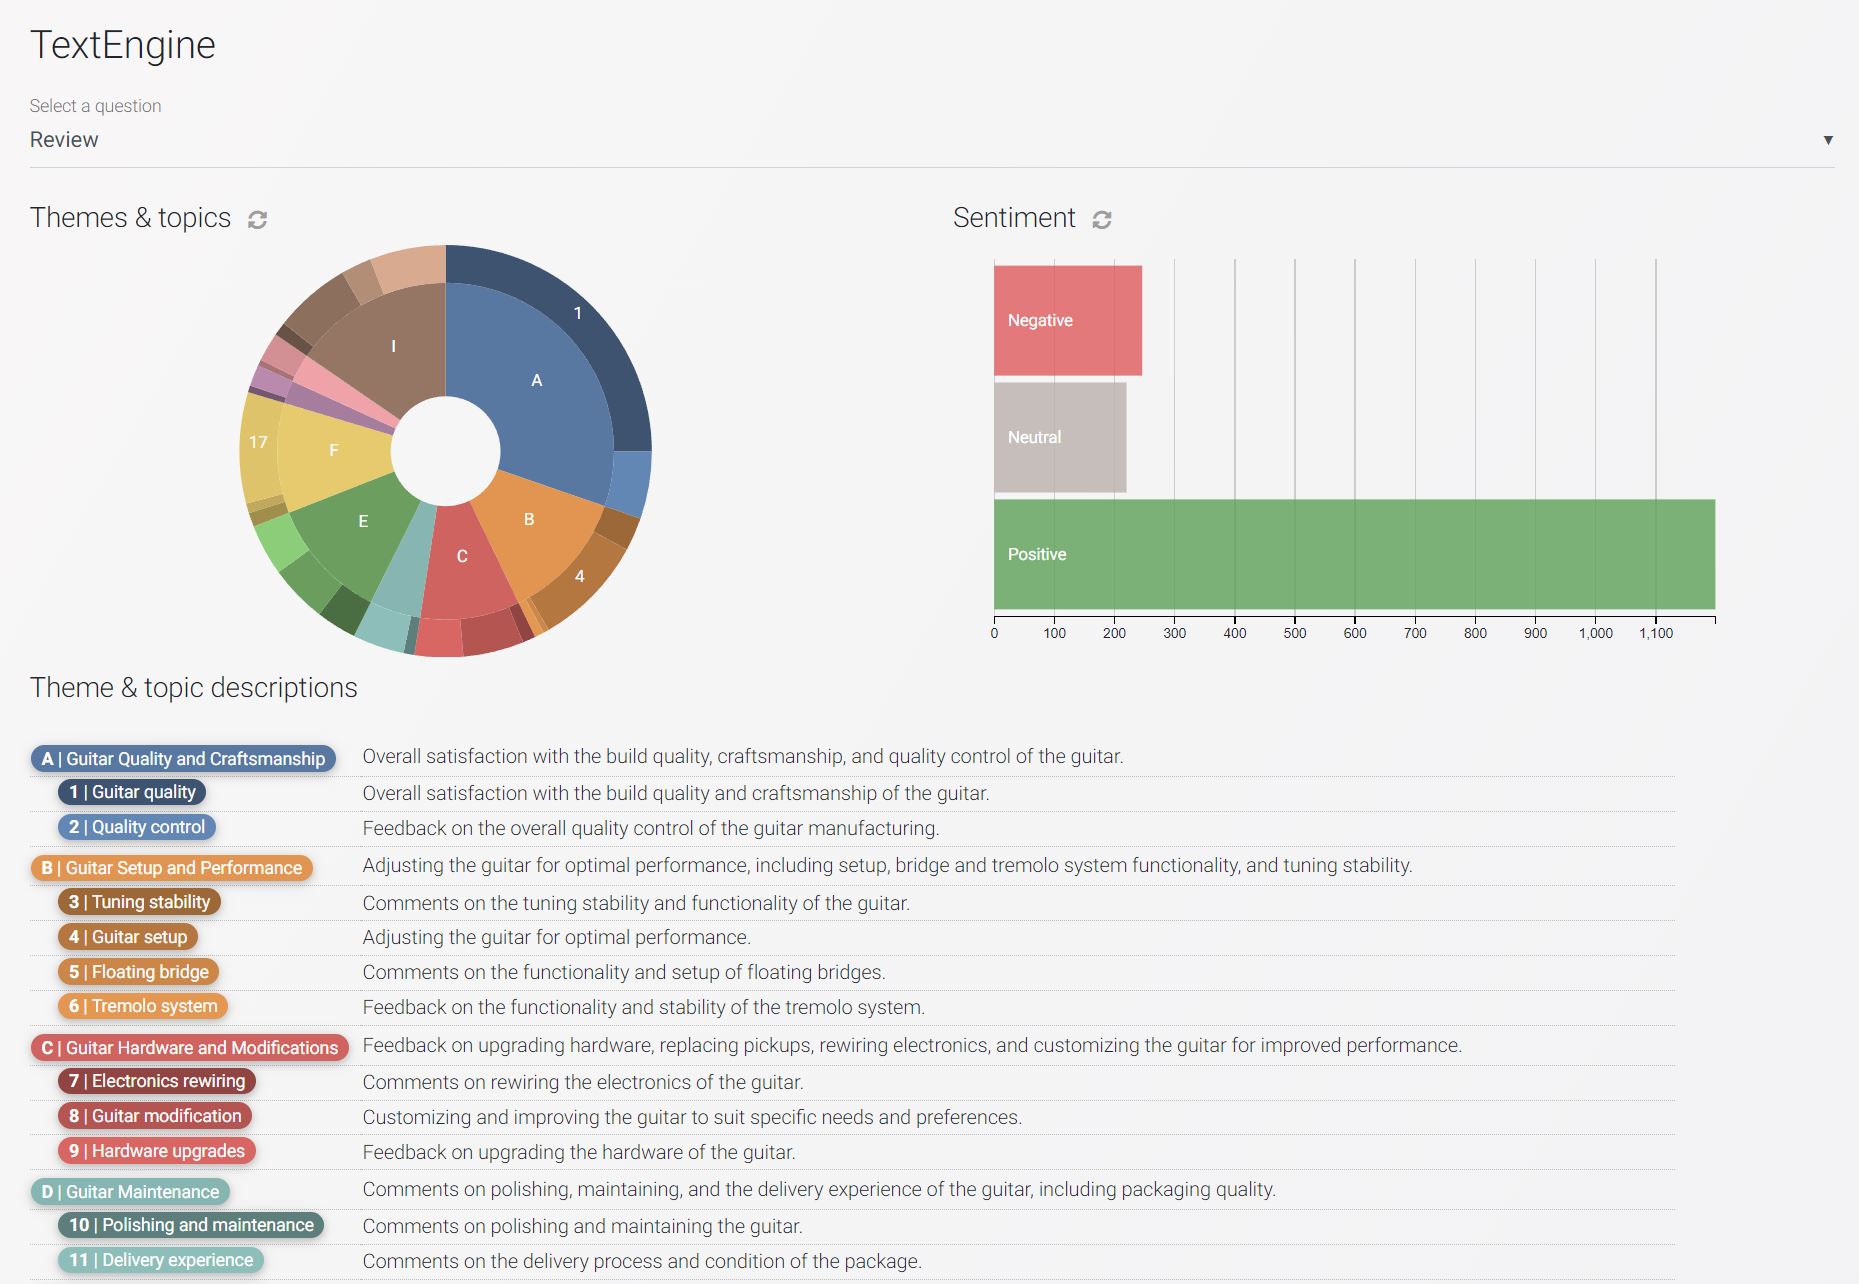
Firrstly, at the top right (under the TextEngine section), select the "Review" column. Looking at the "Themes & topics" chart (at the top right) tells us that "Guitar quality", "Guitar setup", "Guitar hardware", "Guitar maintenance", etc seem to be the answer. Not terribly surprising.
Which is the most popular guitar on Amazon?
The Squier Affinity Telecaster. As we can see from the "Rating number" chart here, this has the highest number of ratings in our dataset, it's affordable (sub $300), and has overwhelmingly positive reviews (check both the Rating chart and the Sentiment chart).
Of the 166 sold, only 7 people gave them a low rating and as we can see from the "Themes and topics" chart (and read from the reviews itself), their biggest concern was guitar setup and tuning stability in particular.
Squier is Fender's entry level brand, while Epiphone is Gibson's. Not surprisingly, the second most popular guitar is Epiphone's Les Paul: also affordable, but not quite as beloved (see Rating and Sentiment charts).
What makes buyers leave a negative review?
The following topics are enriched when we focus on reviews with negative sentiment: "Guitar quality control", "Delivery experience", "Customer service experience".
Interestingly, the ratio of Yes/No in the "Verified purchase" chart doesn't really change when you reset the dashboard (by pressing Q), to show all reviews. So we don't see evidence of unverified purchasers leaving bad reviews at competitor products' pages.
We can further subdivide this gqroup into people who bought more affordable guitars (sub $600) vs. people who bought above the $600 mark. As we can see, people who paid more talk a lot more about "Guitar Quality and Craftsmanship" in their negative reviews. People who spend more, expect more. Again, not terribly surprising but it's nice to see this quantified.
What are the main groups within this dataset?
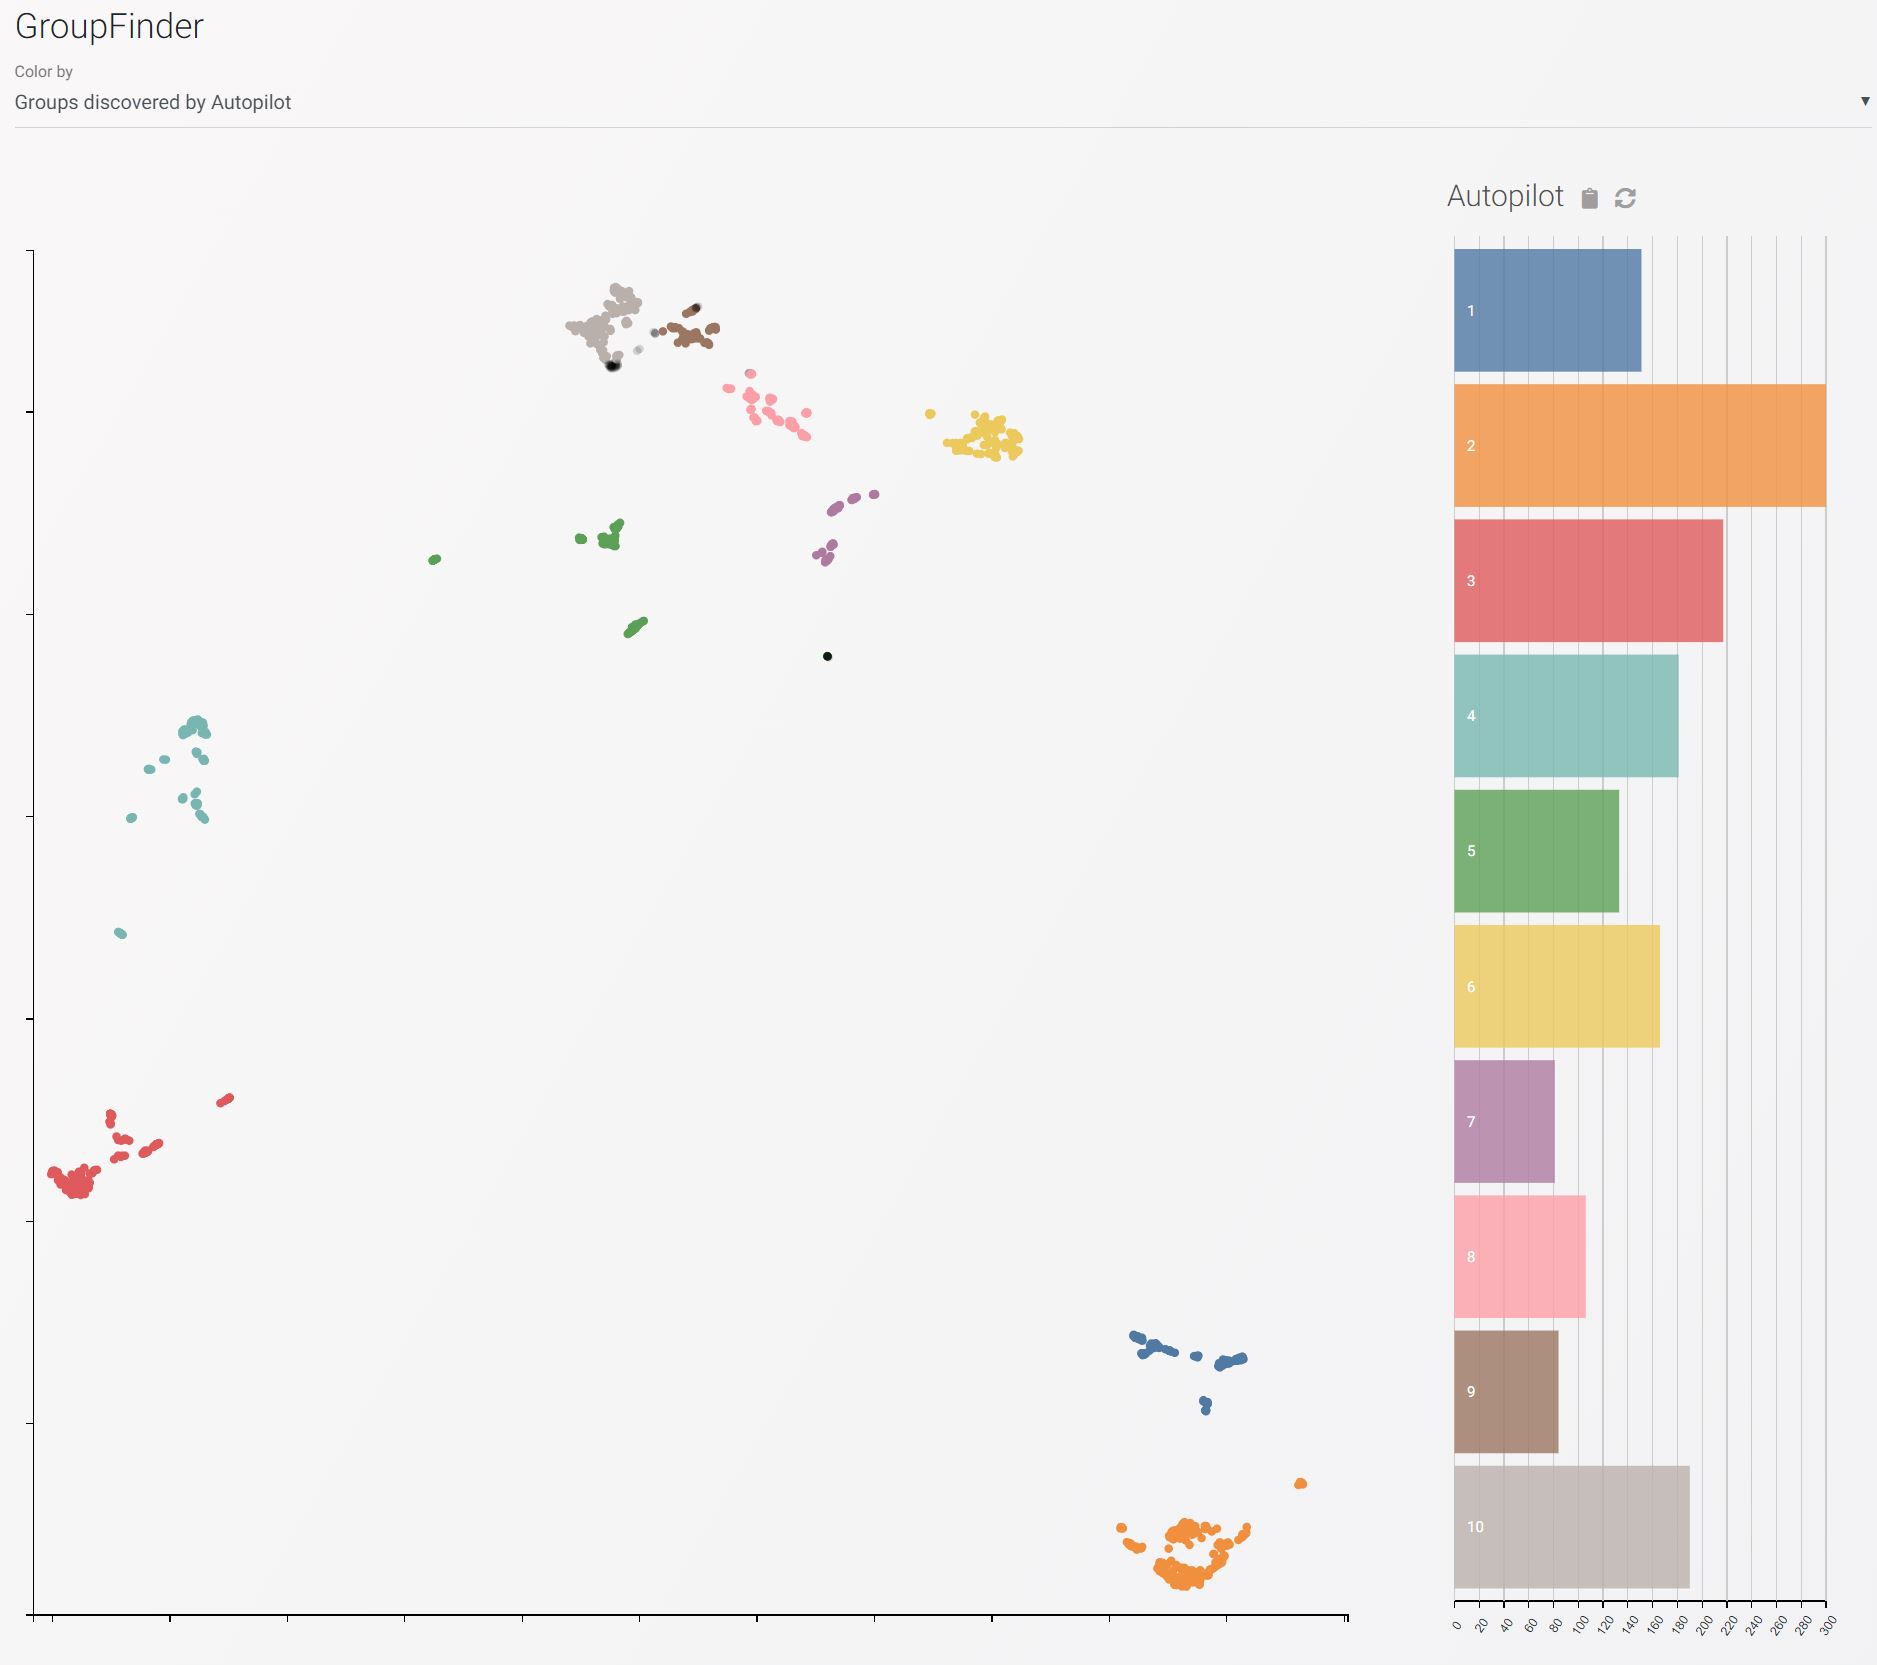
Have a look at the GroupFinder scatter plot below the pie and line charts on the left hand side. Here, each dot represents a guitar purchase (and the associated review). If two dots are closer to each other, they are more similar to each other than to others in the dataset (across all variables, including the free-text ones).
For example, these 34 people are very close to each other and they all bought an Ibanez GRG, which is a modern, metal / rock guitar that resembles with Humbuckers. This little 34 strong group is part of a larger cluster that was marked as group 4 by the CrowdPrisma Autopilot. This group 4 consists of rock / metal type guitars with humbuckers. So, reassuringly, it all makes sense that they would all end up close to each other with the Ibanez GRG buyers.
Make sure to check the other Autopilot groups too. For example group 3 is the Squier Affinity Telecaster crowd, while group 5 contains modern Stratocaster type guitars with humbucker - single coil pickup combination.
You can also color the GroupFinder plot by any variables you like using the dropdown menu above it. For example, here is the plot colored by the Rating. As you can see, in all groups discovered by AutoPilot, one star reviews (blue) are closest to two star reviews (orange), which are closest to three star ones (red) and so on. The same applies to other variables. This is why any two dots close to each other on the GroupFinder scatter plot are truly similar.
What do buyers actually talk about?
Let's start with the most obvious: topics are grouped into themes. We do this to reduce the cognitive load when processing hundreds of pages of text. It's much easier for our brain to keep 10 themes in our head and remember that "Guitar Design and Aesthetics" is yellow, than to have 30 different colors for each topic. Topics are grouped under these themes and represented with different shades of the main theme color. This gives our "Themes & topics" chart a unique rainbow look that isn't just pleasing to the eye, it's actually functional and compresses a lot of information.
To find out what the reviews are about, scroll down and do check them out. You'll find them (all 500+ pages of them) in the dashboard, under the "Themes & topics" chart. Feel free to navigate between the pages with your left and right keys. When you hover over any of the annotations (underlined sections of a text) you'll get a hint of the theme and topic of the assignment.
 As you can see each comment is precisely annotated (often multiple times and in an overlapping manner). This mirrors our everyday intuition that our sentences often convey multiple meanings (hence the overlapping assignments for certain response sections). While this seems trivial, it used to be impossible to achieve this even just two years ago, with the most state-of-the-art natural language processing pipelines. Furthermore, even if the comment is in a different language, it is mapped to the English themes and topics that were identified by CrowdPrisma.
Why should I care?
We barely scratched the surface above, to keep this blog post short and sweet. But if you play a bit more with the dashboard, you'll find that you can go ridiculously deep very easily. To be honest though, we might have exaggerated the title of this post (only slightly). Although this really shouldn't come as a surprise to anyone, digging deep into the dashboard, you'll find that there is no greatest guitar of them all. You'll instead find dozens of weird and interesting insights that would be totally impossible to get to without having all the 500+ pages of reviews read, meticulously annotated and cross-referenced with all other variables.
However, we didn't build CrowdPrisma to find the greatest guitar or to settle feuds between guitarists. So let's stop for a minute and think about what this dashboard actually provides. It gives you the ability to instantly test hypotheses about your data, while treating free-text responses just like any other quantitative variable.
That last bit ("treating free-text responses just like any other quantitative variable") is so easy to write down, yet it's been the unattainable holy grail of countless researchers and companies before. Free-text is notoriously hard to analyze, quantify and especially to integrate into any quantitative analysis (for obvious reasons). But free-text questions are often the only way to a meaningful understanding of what we want to study. Why do our employees churn? Why do our customers choose our competitor? Why is my legislation facing strong opposition from the public? Realistically, these are all questions that can only be answered with free-text. Not with numbers and not with multiple choice options.
With the Prisma Dashboard we managed to seamlessly jump between coded and quantitative variables and 500 pages of free-text. More importantly, we were able to reason about their intricate relationship, leading to a much deeper understanding of the intent and drivers of these guitarists.
While we love guitarists and adore their obsession, we didn't build CrowdPrisma (just) for them. We built it for
- market and policy researchers who need to understand nuanced opinions and positions that cannot be expressed in multiple-choice or other coded questions,
- CX and UX professionals who know that customer and user feedback cannot be wholly captured with a sliding scale,
- HR professionals and managers who know deep down, that they have to go beyond CSAT scores to retain and engage their workforce,
- researchers of all types who have complex surveying needs and are carrying out vital exploratory work in social and political sciences,
- and for everyone who wants to get to the WHY behind the what and therefore truly understand their subject of study.